Introduction to Crypto Technical Analysis
In the constantly evolving world of crypto trading, staying ahead of market trends is crucial. With billions in losses attributed to miscalculations and market volatility, particularly the reported $4.1B lost to DeFi hacks in 2024, the importance of mastering crypto technical analysis indicators cannot be overstated. This article will delve into the various indicators that traders use to make data-driven decisions and how you can leverage them to optimize your investments. Additionally, we will examine the growth of crypto users in Vietnam, reaching an annual increase of over 51% in 2023, emphasizing the need for effective analytical strategies.
Understanding Technical Analysis in Crypto
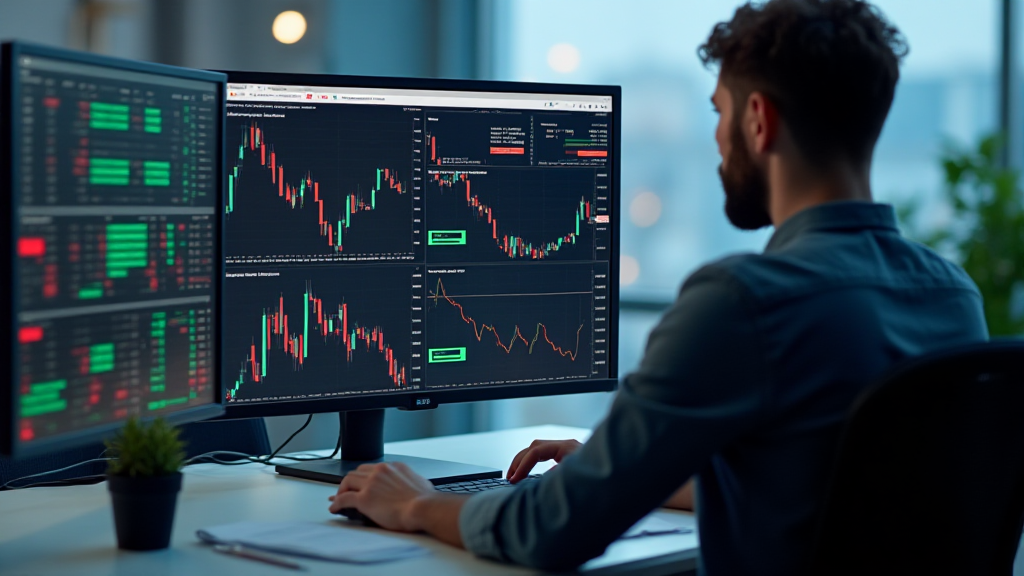
Technical analysis involves evaluating market data, primarily price and volume, to forecast future price movements. Unlike fundamental analysis, which considers the underlying factors such as project viability and news events, technical analysis focuses solely on market trends and price data. Here’s a breakdown of key components:
- Price Charts: Essential for visualizing price movements over various periods.
- Volume Analysis: Indicates the strength of a price movement by measuring the number of assets traded.
- Trends: Understanding upward, downward, and sideways trends to position your trades effectively.
Key Technical Indicators
Various indicators are employed by traders to identify patterns and make predictions. Let’s discuss some of the most common crypto technical analysis indicators:
1. Moving Averages
Moving averages are a popular tool for smoothing out price data over a specific period. Simple Moving Average (SMA) and Exponential Moving Average (EMA) provide insights into market trends. Traders often look for crossover points between different moving averages as potential buy or sell signals.
2. Relative Strength Index (RSI)
The RSI measures the speed and change of price movements, providing insights into whether an asset is overbought or oversold. An RSI above 70 typically indicates an overbought condition, while a level below 30 signals an oversold condition.
3. Moving Average Convergence Divergence (MACD)
MACD helps differentiate between momentum and trend strength. By analyzing two moving averages, traders can identify possible buy and sell signals based on the MACD line’s interaction with the signal line.
4. Bollinger Bands
Bollinger Bands consist of a middle band and two outer bands. They squeeze together during low volatility periods and expand during high volatility, indicating potential trading opportunities.
Applying Technical Indicators to Your Trading Strategy
Incorporating these indicators into your trading strategy effectively can improve accuracy in your decisions. Here are a few steps to consider:
- Backtesting: Test your strategy against historical data to evaluate its effectiveness.
- Combining Indicators: Use a combination of indicators to corroborate signals, increasing reliability.
- Adjusting for Market Conditions: Be aware of market behavior – different conditions may require different approaches.
Common Pitfalls in Technical Analysis
While technical analysis is a powerful tool, traders often fall prey to certain common pitfalls:
- Over-reliance on Indicators: Indicators are not foolproof—always consider external factors.
- Ignoring Market News: Major developments can swiftly alter market dynamics.
- Neglecting Risk Management: Always implement stops to safeguard your assets from potential losses.
The Role of Technical Analysis in the Vietnamese Crypto Market
Vietnam has seen rapid growth in the adoption of cryptocurrency. As Bitcoin and other altcoins gain popularity, it’s crucial for local traders to understand technical indicators to make wise investment decisions. The user growth rate in Vietnam currently stands at 51% annually, underlining the significance of technical analysis in this emerging market.
Conclusion
Understanding crypto technical analysis indicators can significantly impact your trading success. By integrating these indicators into your investment strategies, you can make informed decisions amidst market volatility. Ensure to remain vigilant about market conditions and external factors that might influence price movements. The burgeoning cryptocurrency market in Vietnam offers ample opportunity for traders who equip themselves with the right tools and knowledge.
For more information about cryptocurrency trading and technical analysis, visit hibt.com. Remember, investing in cryptocurrencies carries risks, and it’s essential to consult local regulators before making any trades.
Expert Author: John Doe, a financial analyst with expertise in blockchain technology, has published over 20 papers on financial modelling and risk analysis in crypto and has overseen audits of prominent blockchain projects. He continues to engage with the crypto community, sharing knowledge and strategies with budding traders.